Core decision
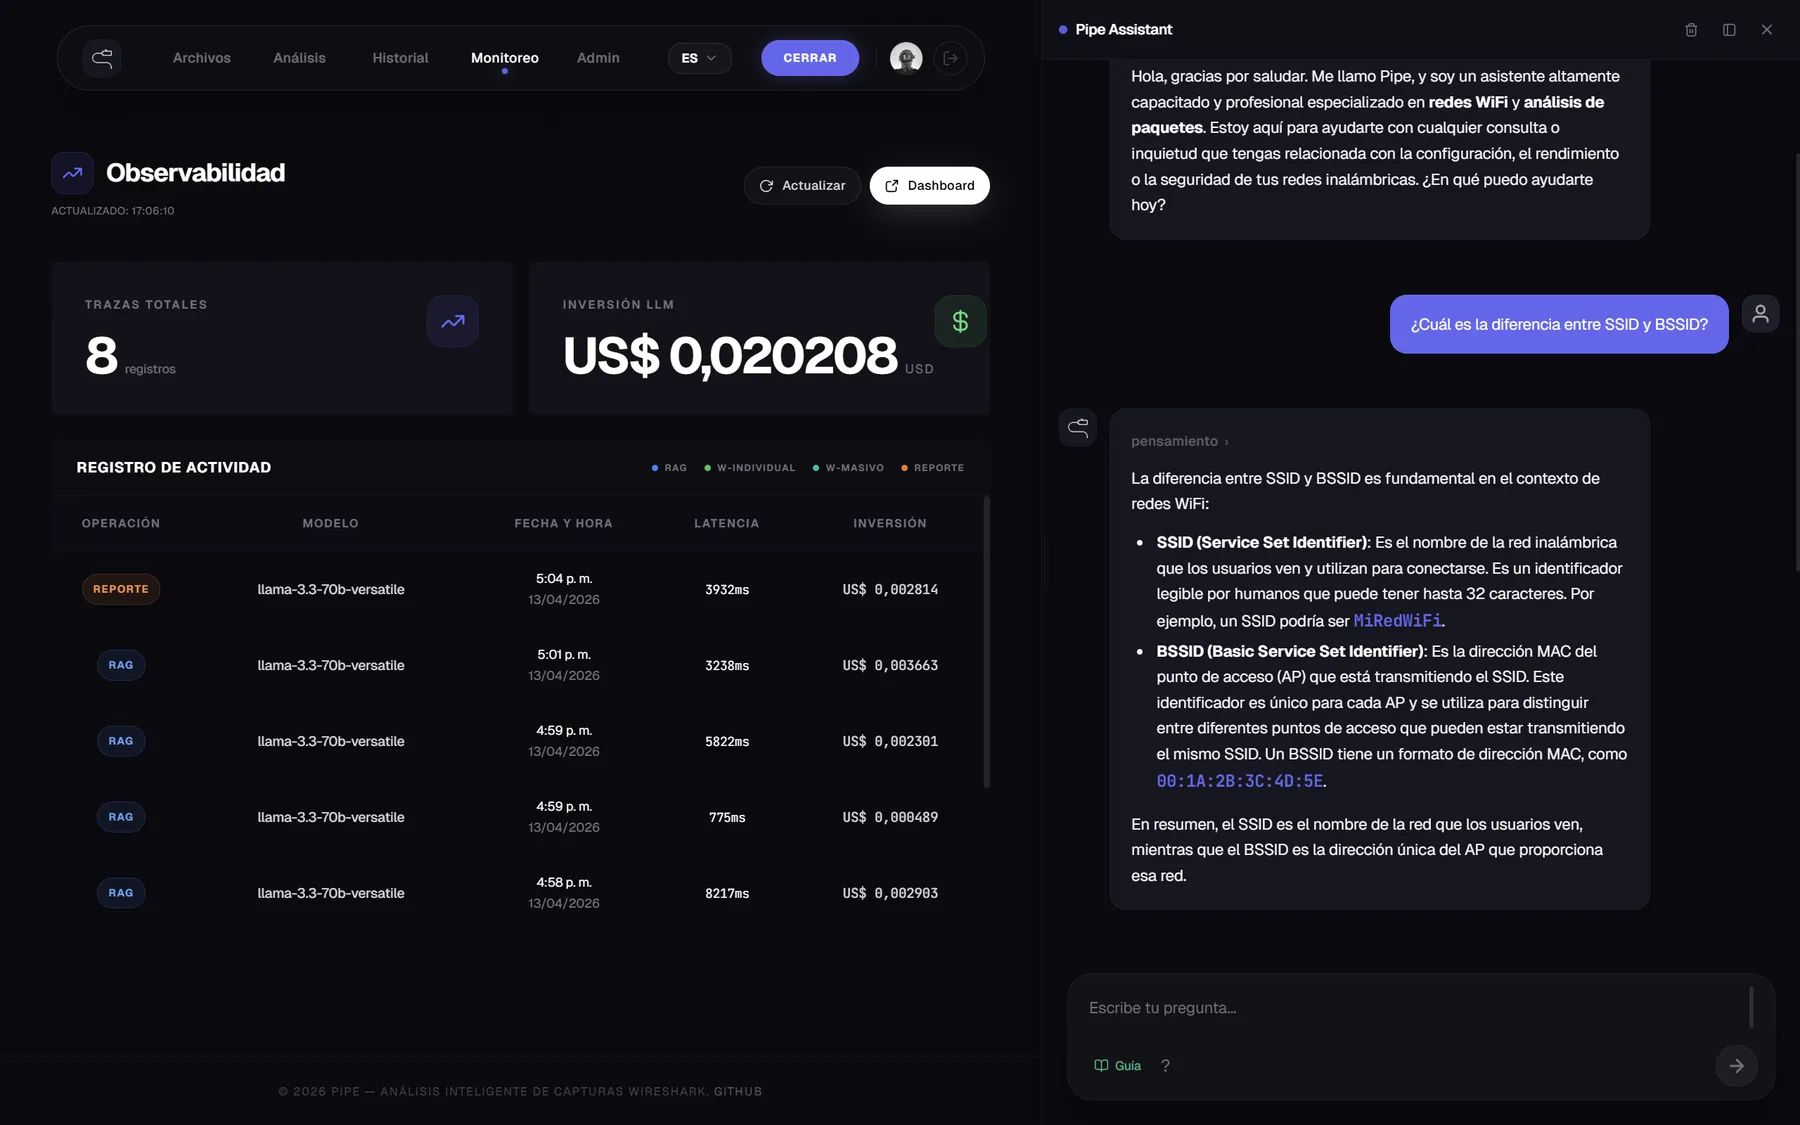
A dispatcher classifies each query before processing it and routes between Groq (Llama 3.3), Gemini 2.0 Flash and GPT-4o by cost and quality. Every operation records cost, latency and trace per model.
What happens to a capture
- capture .pcap / .pcapng
The user uploads the file and picks the vendor, project and client MAC address.
- tshark
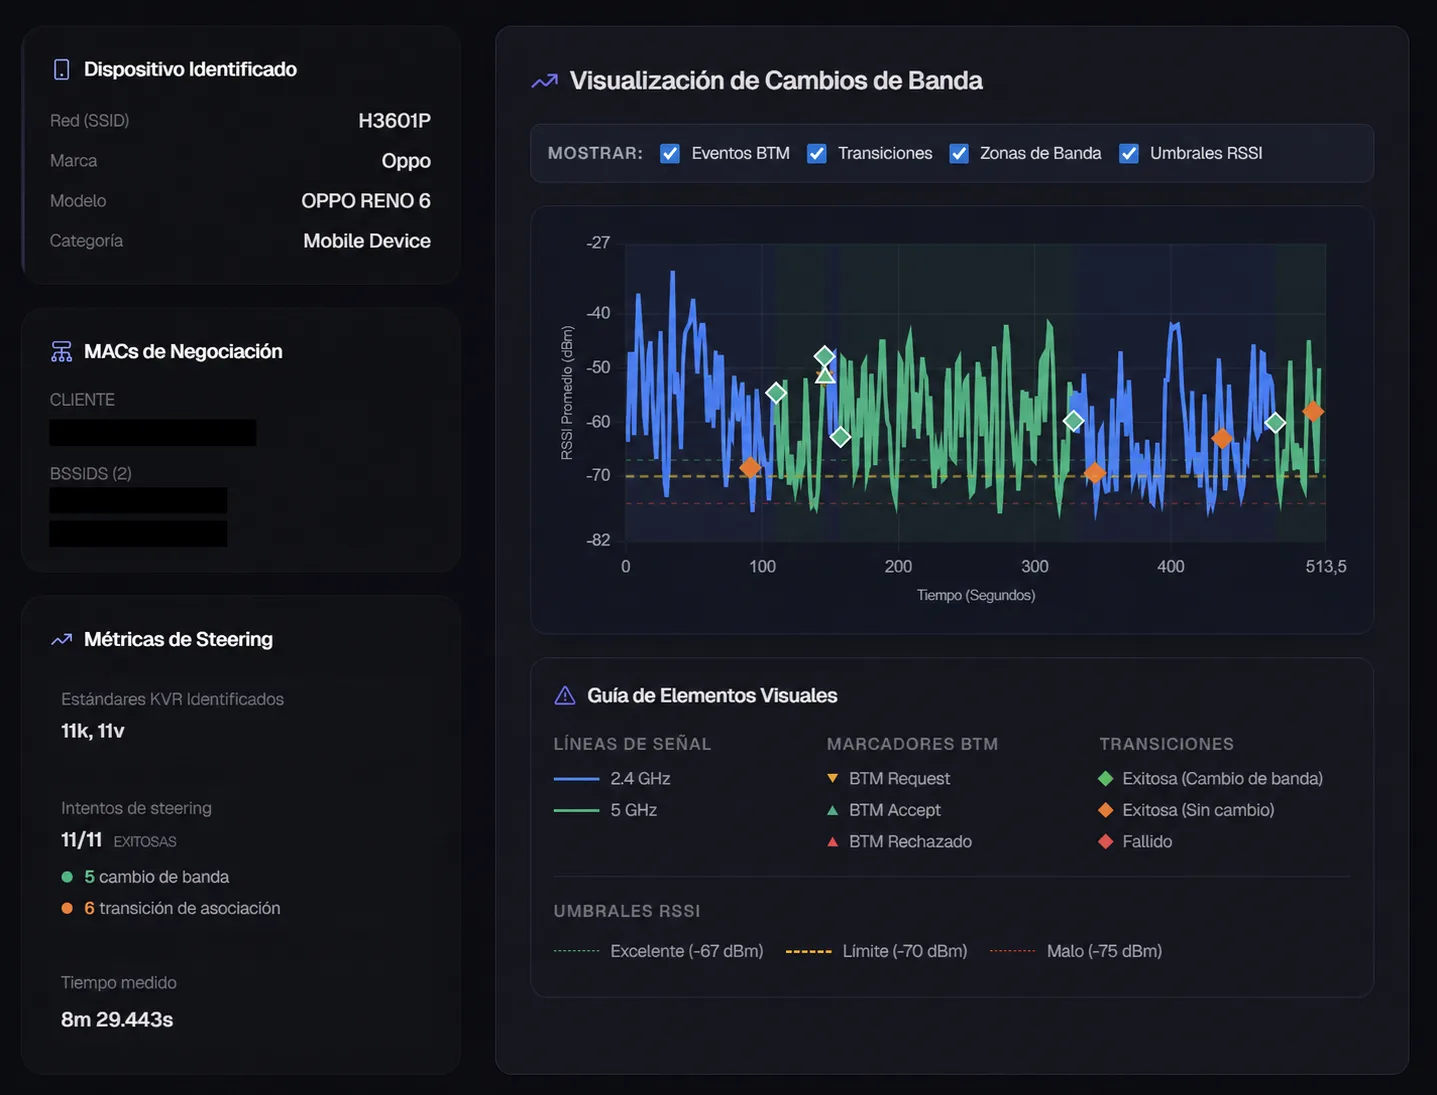
Extracts the 802.11 frames: beacons, BTM, association, reassociation and deauthentication.
- BTM analyzer
Computes the Band Steering metrics: transition latency, acceptance rate and 802.11k/v/r verification.
- LLM analysis
Evaluates compliance, identifies anomalies and proposes improvements.
- persistence in three databases
PostgreSQL for the analysis, Qdrant for semantic search and FalkorDB for the topology.